Viewing raw HTTP requests for debugging purposes
There are times when you want to view the raw HTTP requests that are being sent from a client to a server. This can, for example, be when you are developing an application that sends or receives HTTP requests or are using a third-party tool to test HTTP-based APIs. When you’re writing code that sends HTTP requests you can usually only guess what the actual raw HTTP request will look like. When using tools such as SoapUI or Postman you’ll get a better notion of what the raw request will look like. However, there are often extra headers and so on that gets added later by the respective applications (such as Content-Length or User-Agent), that are not necessarily shown in the GUI itself.
This post gives a brief overview over how I usually view the raw HTTP requests in order to debug them. Some methods are better than other in different circumstances, which is why I list several methods.
Fiddler
The easiest way to debug HTTP requests, in my opinion, is by using Fiddler. I’ve only used it for Windows, so I don’t know how well it works for Linux and OS X. Fiddler can be downloaded from the official home of Fiddler. You are required to type in an email and what you’re using Fiddler for, but this can be whatever you like. You are not required to give them a valid email, you’ll get to download the software anyway.
Fiddler generally works out-of-the-box, but if it doesn’t you can try to look up in the documentation on how to set it up. Fiddler works by setting up a proxy on port 8888. It will therefore sit between the client and the server and listen to requests and responses, which it shows in a list. If you’re using a tool such as SoapUI you might have to restart it after starting Fiddler. Otherwise it will not use the Fiddler proxy. You might also have to restart the tool or any consoles after shutting down Fiddler, in order to stop using the proxy.
To use Fiddler you just have to start it, assuming you have set up the client if that’s needed. It will start listening to outgoing request and incoming responses. You can toggle the listening status with F12. You generally only want to log while debugging. Otherwise the list will start filling up with a ton of request. Here is a request I sent with SoapUI being listed in Fiddler:
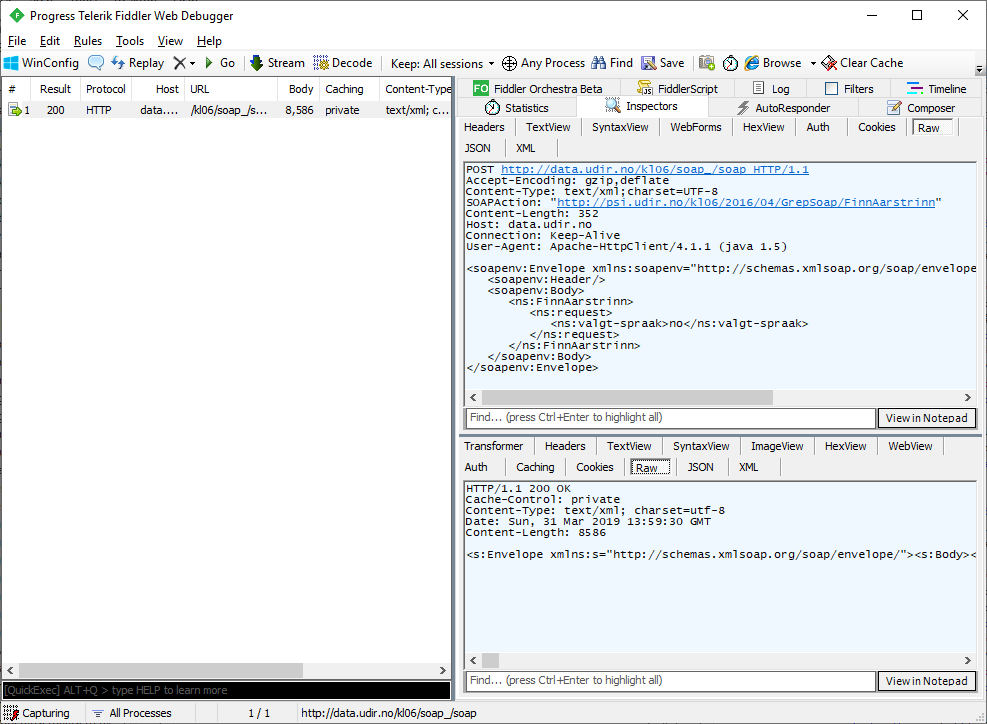
We can see the request body under the Inspectors tab. To see the raw request use the Raw sub tab.
Fiddler is a fairly advanced tool, but easy to get into. You can write your own extensions in .NET (C#). There are more info about that here.
netcat
netcat is a well-known network tool used for creating TCP and UDP connections. netcat was originally written for Unix, but is now also available for Windows and OS X. Here I’ll use ncat, which is a fork of netcat. You might have problems using netcat in corporate environments. It’s often blocked for security reasons, as it can be used as a port scanner and for creating backdoors.
netcat can be used for many things, one one of them is to make it act as a server that listens to a given port. That is done by running:
$ nc -l -p 1234
I’m now listening to port 1234 for anything that’s willing to send to it. netcat won’t respond to the request unless you specifically make a response yourself (by writing something inside the console window or by piping into netcat).
So if I point the client (in this case SoapUI) to http://localhost:1234 it will send the data to the server netcat made. The text in the netcat window is the raw data that SoapUI sends:
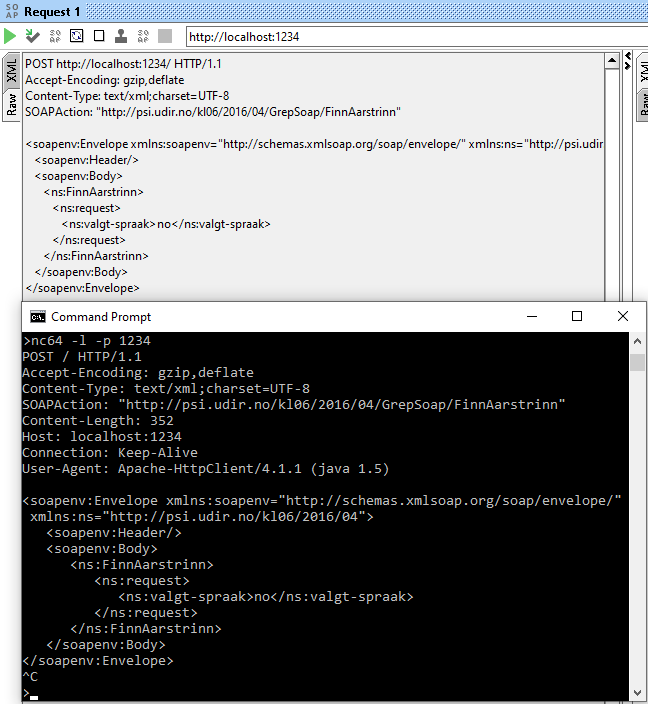
As we can see, SoapUI adds several headers that we’re unable to see in SoapUI itself. netcat will not forward the request to the actual server we’re trying to use, and the connection will eventually time out, unless you write something in the netcat window.
Wireshark
Wireshark is a tool I’ve written several posts about before. Wireshark is easy to use and supported on all major operating systems. It’s a full blown packet capturing and protocol analyzing application that can do way more than just log HTTP requests. It can be downloaded from the Wireshark homepage. You might have problems using Wireshark in corporate environments, as it can be used to sniff passwords etc. You probably also need admin rights to install and use it.
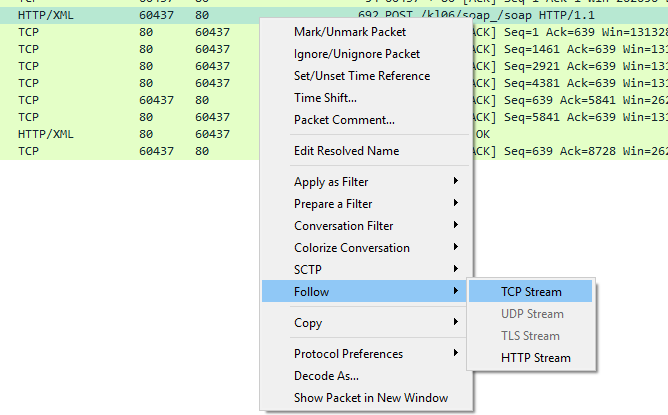
To see HTTP requests in Wireshark you just have to start capturing on the correct network adapter. The HTTP request will exists as one or more packets, and potentially the same for the response. Just right click on the packet and choose Follow –> TCP stream.
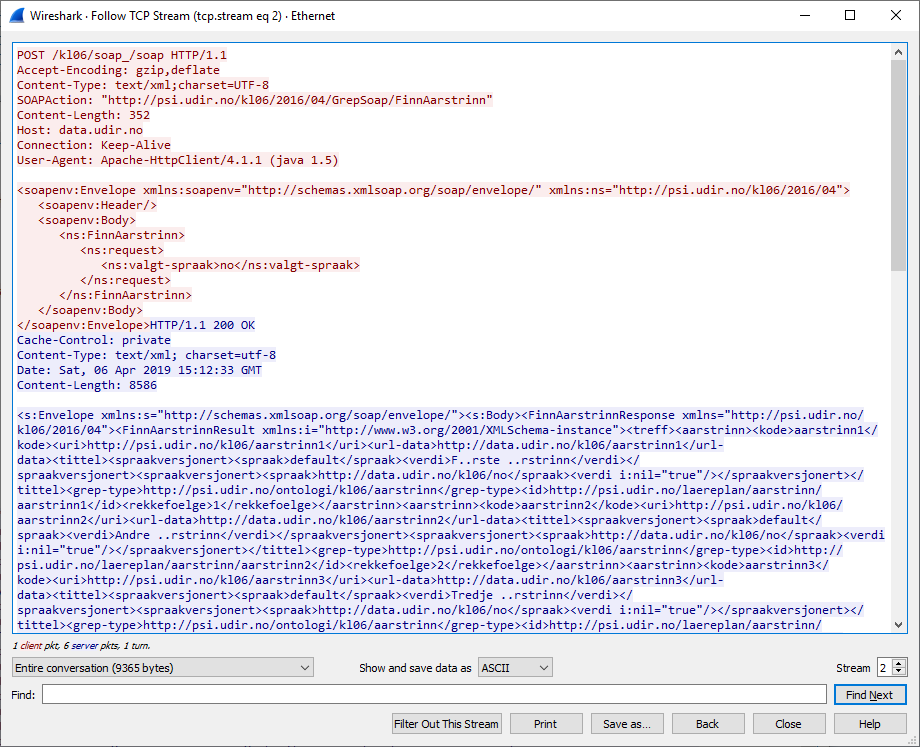
This will show the stream of packets between the client and server and also show the request and response like this:
Tracing requests with the framework in use
You might be unable to install Fiddler, Wireshark and similar applications in a production environment. This is where it’s nice to log the requests to a file or a database instead. Here is an example where I use the tracing functionality in the .NET framework to log requests and other data to two different log files. You can probably find similar examples for Java, C++, etc. by searching Google.
Let’s say we have the following application:
using System;
using System.Collections.Generic;
using System.Diagnostics;
using System.Threading.Tasks;
using psi.udir.no.kl06._2016._04;

namespace TracingTest
{
    class Program
    {
        static async Task Main(string[] args)
        {
            var client = new GrepSoapClient();

            var request = new finnaarstrinnrequest() { valgtspraak = "no" };
            var response = await client.FinnAarstrinnAsync(request);

            Console.WriteLine(response.treff[0].kode);
        }
    }
}
It sends a SOAP request and prints a part of the response to the console. In order to log the raw request and response I have to add a listener to the trace source of System.Net and System.ServiceModel.MessageLogging. That is usually done by creating a configuration file (app.config) and setting it up so it looks something like this:
<configuration>
    <system.diagnostics>

        <trace autoflush="true" />

        <sources>
            <source name="System.Net" maxdatasize="1024">
                <listeners>
                    <add name="SystemNetTraceFile"/>
                </listeners>
            </source>
            <source name="System.ServiceModel.MessageLogging">
                <listeners>
                    <add name="SystemServiceModelMessageLoggingTraceFile"/>
                </listeners>
            </source>
        </sources>

        <sharedListeners>
            <add
              name="SystemNetTraceFile"
              type="System.Diagnostics.TextWriterTraceListener"
              initializeData="System.Net.trace.log" />
            <add
              name="SystemServiceModelMessageLoggingTraceFile"
              type="System.Diagnostics.TextWriterTraceListener"
              initializeData="System.ServiceModel.MessageLogging.trace.log" />
        </sharedListeners>

        <switches>
            <add name="System.Net" value="Verbose" />
            <add name="System.ServiceModel.MessageLogging" value="Verbose" />
        </switches>

    </system.diagnostics>

    <system.serviceModel>
        <diagnostics wmiProviderEnabled="true">
            <messageLogging
                logEntireMessage="true"
                logMalformedMessages="true"
                logMessagesAtServiceLevel="true"
                logMessagesAtTransportLevel="true"
                maxMessagesToLog="3000"
            />
        </diagnostics>
    </system.serviceModel>
</configuration>
It’s built on this and this example.
I attach one listener to the System.Net trace source and one to the System.ServiceModel.MessageLogging
trace source. They will log to System.Net.trace.log and System.ServiceModel.MessageLogging.trace.log,
respectively. The log file will look something like this after sending the request:
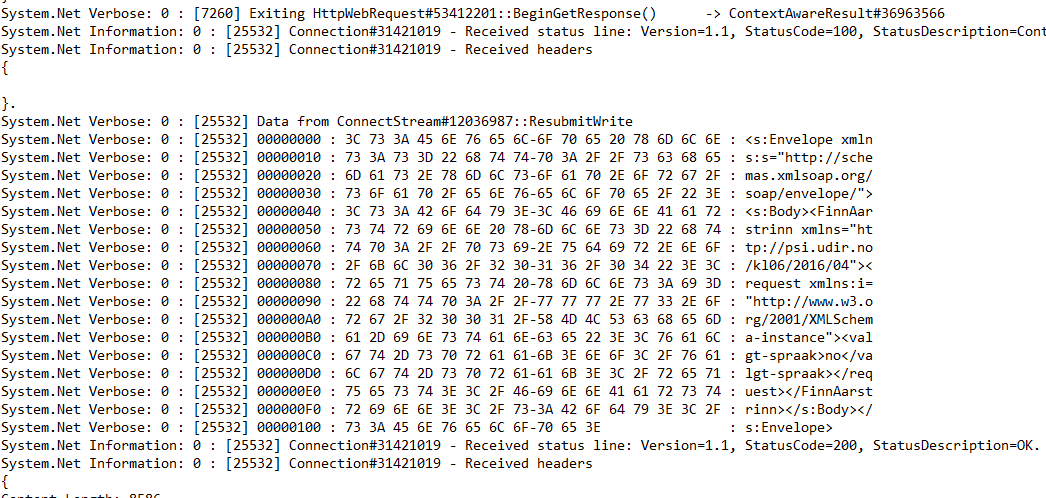
We can see the raw request and response, as wanted. If this particular instance I used SOAP. It will, of course, work for all HTTP requests.
This doesn’t work very well for .NET Core, as of now, but I believe it will improve in version 3.0.
Summary
- I recommend using Fiddler if that’s possible. Windows might be needed, and it works best when in a development environment where you are able to install applications.
- netcat is very light weight and is often installed in *nix environments. It’s a multipurpose networking utility that’s used for much more than viewing raw requests. Often not possible to use netcat in corporate environments.
- Wireshark is a full-blown packet analyzer and is better suited when you are developing applications that use protocols at a lower abstraction level than HTTP. Is also impossible to install and use in some corporate environments.
- Tracing and logging requests with the used framework (e.g. .NET, Spring, etc.) is typically needed in production environments as you can’t really install Fiddler, Wireshark, etc. there.