Creating a Wireshark dissector in Lua - part 2 (debugging and a more advanced dissector)
This post continues where the first post left off.
In this post we will first look at basic debugging of Lua dissectors. After that we will extend the dissector to display the names of the opcodes, rather than just the numbers.
Debugging
When I’m talking about debugging, I am not really thinking of debugging in the normal way, where you use a symbolic debugger to step through code. That’s not something you’ll do here. I am rather thinking about the process of finding and fixing errors in the code. There are generally three ways to debug Lua dissectors.
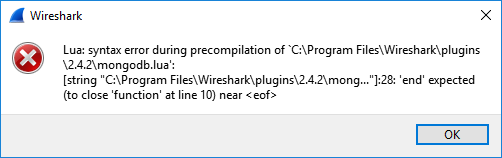
The first is to check if you get any error messages during startup of the script. This happens either when you start
Wireshark or when you reload the script with Ctrl+Shift+L. Syntax errors in the script will be caught this way.
Here is what an error message looks like when an end statement is missing:
Runtime errors are often shown in the subtree for the dissector. For example, if a function is called with the wrong name, the error message will look like this.

Finally, Wireshark has a Lua console built in that you can print error messages to. It’s found in the Tools → Lua
menu. Wireshark has a function called print() that can be used for logging. So the following code:
print("buffer length: " .. length)
will end up looking like this when printed to the console:
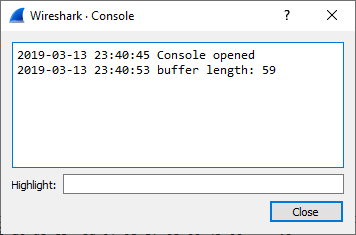
where .. is used for string concatenation.
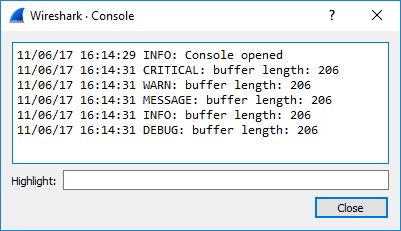
In Wireshark versions older than 3.0 there are different functions used for logging. These are:
critical("message"), warn("message"), message("message"), info("message") and debug("message"). They all print
to the console, and the difference is the perceived severity level. The following code:
critical("buffer length: " .. length)
warn("buffer length: " .. length)
message("buffer length: " .. length)
info("buffer length: " .. length)
debug("buffer length: " .. length)
will end up looking like this when printed to the console:
You can access the debug library by requiring it at the start of the file
local d = require('debug')
and then start using it by calling its functions. For example:
print(d.traceback())
And that’s pretty much what we have available for debugging. Don’t expect any fancy IDE with a built-in debugger when dealing with Lua dissectors. If you want to, you could try to get ZeroBrane Studio working, but I haven’t figured out how to do that easily, so I’m going with printf-style debugging myself.
Extending the MongoDB protocol dissector
In the previous post we made a dissector that ended up looking like this in the packet details pane:
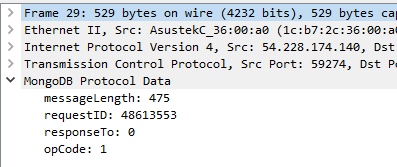
The opcode here is only a number. It would be nicer if we showed the opcode name too. According to the MongoDB wire protocol, the opcodes have the following names associated with them:
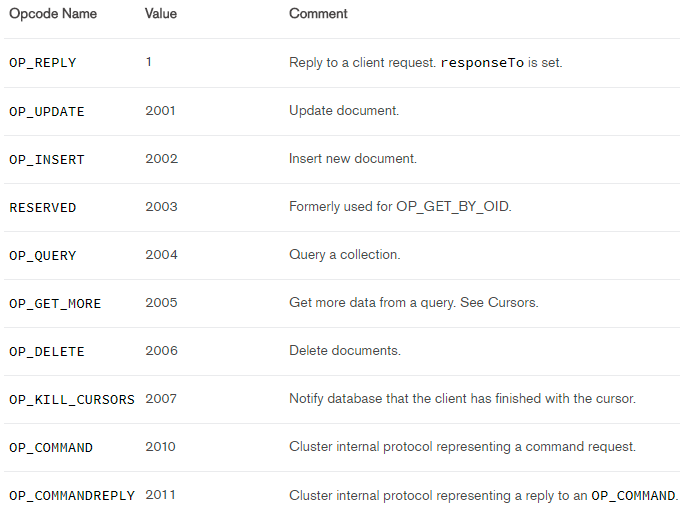
To grab the opcode as an integer we can use
local opcode_number = buffer(12,4):le_int()
le_int() gets a little endian int from the buffer range. The variable opcode_number now contains an int representing the
opcode in decimal. We can then make a function that returns the opcode name given the opcode number:
function get_opcode_name(opcode)
  local opcode_name = "Unknown"

      if opcode ==    1 then opcode_name = "OP_REPLY"
  elseif opcode == 2001 then opcode_name = "OP_UPDATE"
  elseif opcode == 2002 then opcode_name = "OP_INSERT"
  elseif opcode == 2003 then opcode_name = "RESERVED"
  elseif opcode == 2004 then opcode_name = "OP_QUERY"
  elseif opcode == 2005 then opcode_name = "OP_GET_MORE"
  elseif opcode == 2006 then opcode_name = "OP_DELETE"
  elseif opcode == 2007 then opcode_name = "OP_KILL_CURSORS"
  elseif opcode == 2010 then opcode_name = "OP_COMMAND"
  elseif opcode == 2011 then opcode_name = "OP_COMMANDREPLY" end

  return opcode_name
end
Finally, we have to replace the old addition to the subtree with the following code:
local opcode_name = get_opcode_name(opcode_number)
subtree:add_le(opcode, buffer(12,4)):append_text(" (" .. opcode_name .. ")")
We append the name of the opcode in parentheses to the original statement that only showed opcode number. The packet details pane in Wireshark will then end up looking like this:
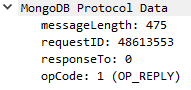
With the final code being:
mongodb_protocol = Proto("MongoDB",  "MongoDB Protocol")

message_length = ProtoField.int32("mongodb.message_length", "messageLength", base.DEC)
request_id     = ProtoField.int32("mongodb.requestid"     , "requestID"    , base.DEC)
response_to    = ProtoField.int32("mongodb.responseto"    , "responseTo"   , base.DEC)
opcode         = ProtoField.int32("mongodb.opcode"        , "opCode"       , base.DEC)

mongodb_protocol.fields = { message_length, request_id, response_to, opcode }

function mongodb_protocol.dissector(buffer, pinfo, tree)
  length = buffer:len()
  if length == 0 then return end

  pinfo.cols.protocol = mongodb_protocol.name

  local subtree = tree:add(mongodb_protocol, buffer(), "MongoDB Protocol Data")

  subtree:add_le(message_length, buffer(0,4))
  subtree:add_le(request_id,     buffer(4,4))
  subtree:add_le(response_to,    buffer(8,4))

  local opcode_number = buffer(12,4):le_uint()
  local opcode_name = get_opcode_name(opcode_number)
  subtree:add_le(opcode,         buffer(12,4)):append_text(" (" .. opcode_name .. ")")
end

function get_opcode_name(opcode)
  local opcode_name = "Unknown"

      if opcode ==    1 then opcode_name = "OP_REPLY"
  elseif opcode == 2001 then opcode_name = "OP_UPDATE"
  elseif opcode == 2002 then opcode_name = "OP_INSERT"
  elseif opcode == 2003 then opcode_name = "RESERVED"
  elseif opcode == 2004 then opcode_name = "OP_QUERY"
  elseif opcode == 2005 then opcode_name = "OP_GET_MORE"
  elseif opcode == 2006 then opcode_name = "OP_DELETE"
  elseif opcode == 2007 then opcode_name = "OP_KILL_CURSORS"
  elseif opcode == 2010 then opcode_name = "OP_COMMAND"
  elseif opcode == 2011 then opcode_name = "OP_COMMANDREPLY" end

  return opcode_name
end

local tcp_port = DissectorTable.get("tcp.port")
tcp_port:add(59274, mongodb_protocol)
The entire header of the message is now being parsed. The next part will go into how the specific messages can be decoded.